Popular Products
PGA4311UA PGA2320IDW TAS3108DCP MAX5440EAG+ INA1651QPWRQ1 DRV134UA DIR9001PW DIT4192IPW ZL38051LDF1 PCM9211PT
ON Announces Second Quarter 2025 Financial Results
8/7/2025 7:45:48 PM
ON Semiconductor's Second Quarter Financial Report
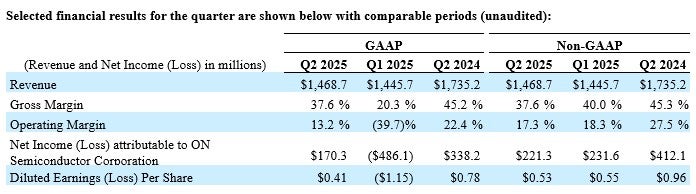
August 5, 2025 - ON Semiconductor (ON, NASDAQ stock code: ON) announced its financial results for the second quarter of 2025. The key highlights are as follows:
· The revenue for the second quarter was 1.4687 billion US dollars.
In the second quarter, both the Generally Accepted Accounting Principles (hereinafter referred to as "GAAP") and the non-GAAP gross profit margin were 37.6%.
In the second quarter, the GAAP operating profit margin and the non-GAAP operating profit margin were 13.2% and 17.3% respectively.
· The GAAP diluted earnings per share for the second quarter was $0.41, while the non-GAAP diluted earnings per share was $0.53.
The operating cash flow was 184.3 million US dollars, and the free cash flow was 106.1 million US dollars.
"The ongoing transformation we are undertaking makes the business model more predictable, demonstrating the effectiveness of our strategy and our commitment to long-term value creation. We are beginning to see signs of stability in the end markets and are ready to benefit from the market recovery," said Hassane El-Khoury, the president and CEO of ON Semiconductor. "While focusing on short-term priorities, we are also laying the foundation for the company's long-term growth through investments in next-generation technologies, further consolidating our market leadership."
The table below summarizes the partial financial performance for the second quarter of 2025 and the comparable period (unaudited):
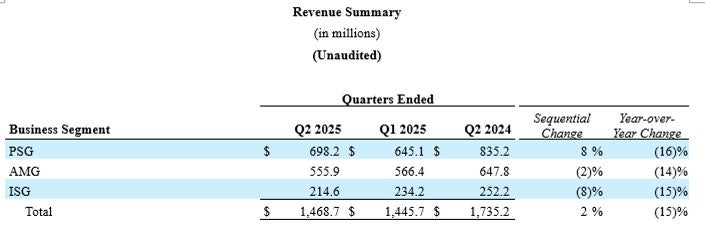 Summary of Revenue for the Second Quarter of 2025
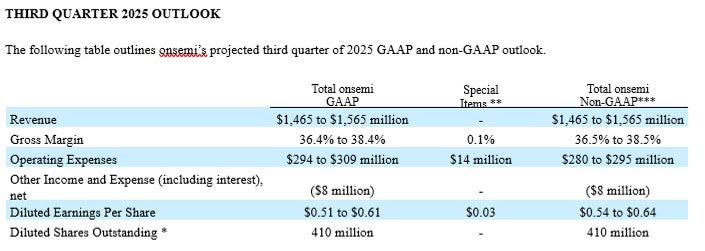
* Diluted shares outstanding can vary as a result of, among other things, the vesting of restricted stock units, the incremental dilutive shares from the convertible notes, and the repurchase or the issuance of stock or convertible notes or the sale of treasury shares. In periods when the quarterly average stock price per share exceeds $52.97 for the 0% Notes, and $103.87 for the 0.50% Notes, the non-GAAP diluted share count and non-GAAP net income per share include the anti-dilutive impact of the hedge transactions entered concurrently with the 0% Notes, and the 0.50% Notes, respectively. At an average stock price per share between $52.97 and $74.34 for the 0% Notes, and $103.87 and $156.78 for the 0.50% Notes, the hedging activity offsets the potentially dilutive effect of the 0% Notes, and the 0.50% Notes, respectively. In periods when the quarterly average stock price exceeds $74.34 for the 0% Notes, and $156.78 for the 0.50% Notes, the dilutive impact of the warrants issued concurrently with such notes is included in the diluted shares outstanding. GAAP and non-GAAP diluted share counts are based on either the previous quarter's average stock price or the stock price as of the last day of the previous quarter, whichever is higher.
** Special items may include: amortization of acquisition-related intangibles; expensing of appraised inventory fair market value step-up; restructuring-related cost of revenue charges; non-recurring facility costs; in-process research and development expenses; restructuring, asset impairments and other, net; goodwill impairment charges; gains and losses on debt prepayment; actuarial (gains) losses on pension plans and other pension benefits; and certain other special items, as necessary. These special items are out of our control and could change significantly from period to period. As a result, we are not able to reasonably estimate and separately present the individual impact or probable significance of these special items, and we are similarly unable to provide a reconciliation of the non-GAAP measures. The reconciliation that is unavailable would include a forward-looking income statement, balance sheet and statement of cash flows in accordance with GAAP. For this reason, we use a projected range of the aggregate amount of special items in order to calculate our projected non-GAAP operating expense outlook.
*** We believe these non-GAAP measures provide important supplemental information to investors. We use these measures, together with GAAP measures, for internal managerial purposes and as a means to evaluate period-to-period comparisons. However, we do not, and you should not, rely on non-GAAP financial measures alone as measures of our performance. We believe that non-GAAP financial measures reflect an additional way of viewing aspects of our operations that, when taken together with GAAP results and the reconciliations to corresponding GAAP financial measures that we also provide in our releases, provide a more complete understanding of factors and trends affecting our business. Because non-GAAP financial measures are not standardized, it may not be possible to compare these financial measures with other companies' non-GAAP financial measures, even if they have similar names.
TeleconferenceON Semiconductor will hold a financial conference call in the Eastern Standard Time (ET) of the United States on August 4, 2025, at 9 a.m. to discuss this release and ON Semiconductor's second-quarter results for 2025. The English conference call will be broadcast live on the "Investor Relations" page of the company's website http://www.onsemi.cn. The live online broadcast will be available for replay on the website approximately one hour later and will be available for 30 days.
About onsemi
onsemi (Nasdaq: ON) is driving disruptive innovations to help build a better future. With a focus on automotive and industrial end-markets, the company is accelerating change in megatrends such as vehicle electrification and safety, sustainable energy grids, industrial automation, and 5G and cloud infrastructure. onsemi offers a highly differentiated and innovative product portfolio, delivering intelligent power and sensing technologies that solve the world's most complex challenges and leads the way to creating a safer, cleaner and smarter world. onsemi is recognized as a Fortune 500® company and included in the Nasdaq-100 Index® and S&P 500® index. Learn more about onsemi at www.onsemi.com.

- Help you to save your Cost and time.

- Reliable package for your goods.

- Fast Reliable Delivery to save time.

- Quality premium After-sale service.